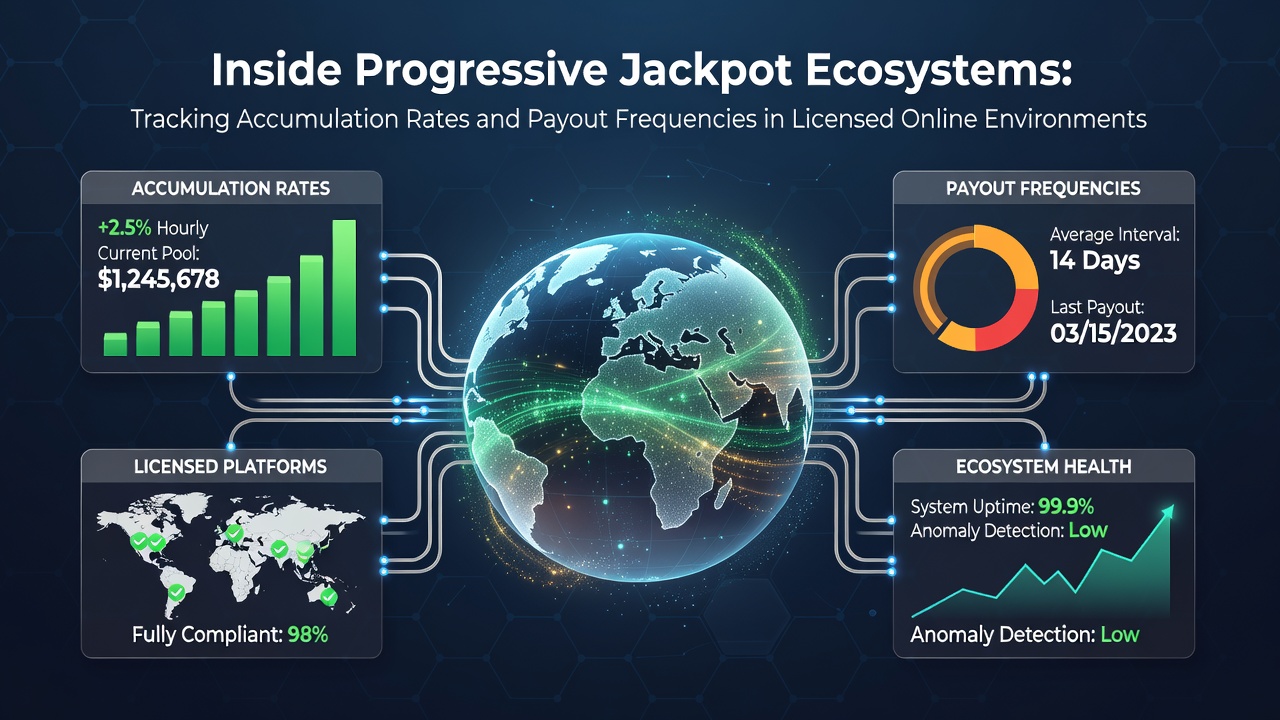
Inside Progressive Jackpot Ecosystems: Tracking Accumulation Rates and Payout Frequencies in Licensed Online Environments
Progressive jackpot systems operate through interconnected networks where each qualifying bet contributes a fixed percentage to a shared prize pool, and operators in licensed jurisdictions maintain detailed logs of these increments to ensure transparency. Software platforms calculate contributions in real time as players place wagers on linked games, while regulatory frameworks require regular audits of the accumulation process to verify that the stated percentages remain consistent across all participating sites.
How Accumulation Mechanisms Function in Networked Environments
Licensed operators integrate progressive pools into slot titles by allocating portions of each bet, often ranging from 0.5 to 3 percent depending on the game configuration, and these increments flow directly into central servers that update visible jackpot meters for all users. Data from multiple jurisdictions shows that wider networks, spanning dozens of casinos, generate faster growth because more players feed into the same pool simultaneously. Operators track these rates through backend dashboards that record every contribution by timestamp, game identifier, and bet amount, which allows them to generate compliance reports for oversight bodies.
Seed amounts establish the baseline for each jackpot cycle, and after a payout occurs the system resets to this predetermined starting value before contributions resume. Research from Canadian provincial regulators indicates that average daily accumulation on major linked systems reached several thousand dollars per network during peak periods in early 2026, with July figures reflecting continued steady increases tied to player volume.
Monitoring Payout Frequencies Across Licensed Platforms
Payout intervals depend on random number generator algorithms calibrated to specific probability thresholds, and licensed environments mandate that these parameters undergo independent testing before deployment. Historical records from accredited testing laboratories reveal that major progressive titles typically trigger payouts after millions of spins, though actual frequencies fluctuate based on total wager volume across the network. Observers note that systems with higher contribution percentages tend to reach payout thresholds more rapidly, while lower percentages extend the intervals between wins.
Operators publish aggregated statistics that detail the number of jackpots awarded within defined periods, and these reports help illustrate patterns without revealing individual player data. Figures from Australian regulatory submissions covering the first half of 2026 demonstrate that networks with over 50 connected sites recorded between four and seven major payouts during that timeframe, aligning closely with pre-launch probability models.
Data Tracking Tools and Reporting Standards
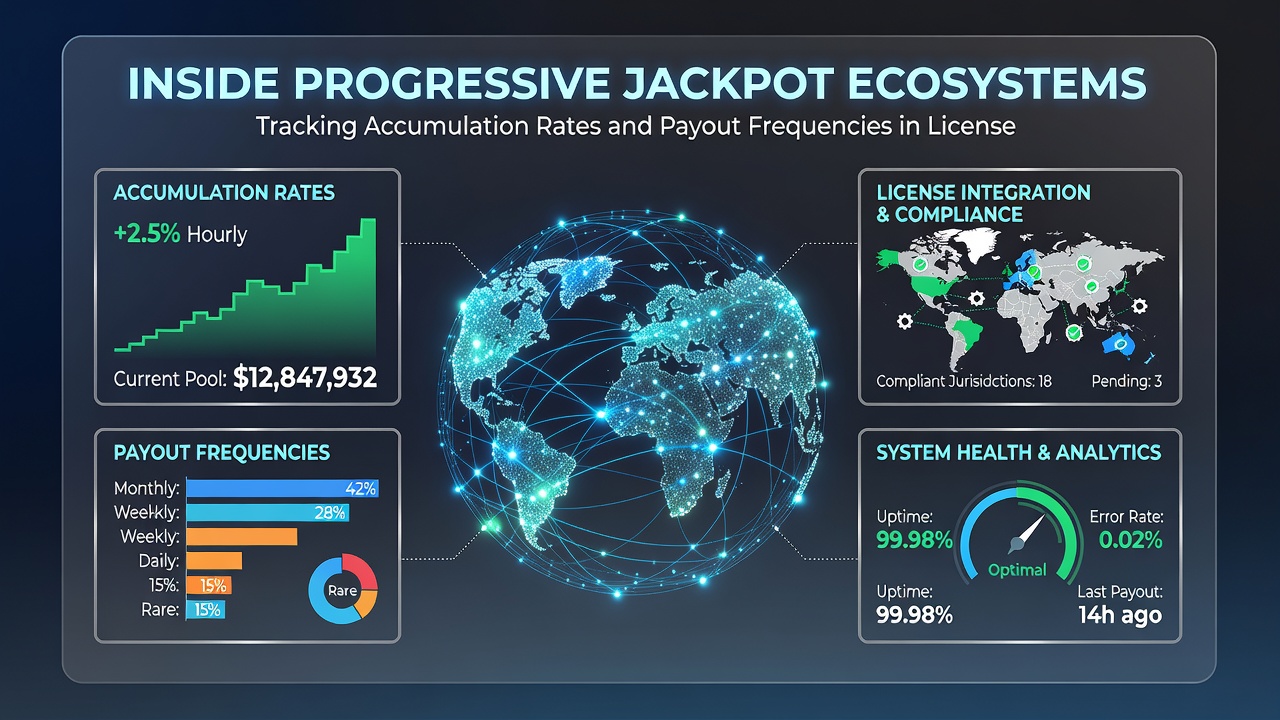
Modern platforms employ specialized jackpot management software that logs every transaction in immutable records, enabling real-time queries on current pool sizes and historical accumulation curves. Regulatory requirements in various regions stipulate that operators submit monthly summaries detailing contribution rates, total wagers processed, and any deviations from expected growth patterns. These submissions undergo cross-verification against raw server logs to confirm accuracy.
One study released by a European research consortium in mid-2026 examined accumulation data from multiple licensed networks and found that daily growth rates averaged 1.8 percent of total bets placed, with minor variations attributable to regional player demographics. Such analyses rely on anonymized datasets that preserve operational privacy while providing regulators with actionable oversight metrics.
Regional Variations in Jackpot Ecosystem Oversight
Different licensing authorities impose distinct reporting cadences and contribution caps, yet all share the core objective of maintaining verifiable fairness in progressive systems. In North American markets, for instance, state-level gaming boards require quarterly audits that include forensic reviews of jackpot reset procedures and meter synchronization across sites. Meanwhile, offshore licensed jurisdictions emphasize continuous monitoring through automated alert systems that flag unusual accumulation spikes or delays.
Industry associations compile comparative tables that contrast payout frequencies across borders, and these resources assist operators in aligning their configurations with local expectations. A 2026 report issued by an international gaming standards organization highlighted that networks operating under multiple licenses maintained consistent contribution percentages despite differing tax structures, because the underlying algorithms remained independent of fiscal calculations.
Conclusion
Progressive jackpot ecosystems in licensed online settings depend on precise tracking of accumulation rates and payout frequencies to uphold operational integrity. Data collection through dedicated software, combined with periodic regulatory reviews, ensures that contribution percentages and reset mechanisms function as specified. Reports from various oversight bodies continue to provide benchmarks that operators use to calibrate their networks, while independent testing maintains alignment between theoretical probabilities and actual outcomes. As player volumes evolve, these monitoring practices adapt to preserve transparency across all participating environments.